Cultivate Labs Support Articles
Identifying your most Accurate Forecasters
One of the most valuable features of Cultivate Forecasts is that it allows you to identify the individuals who make the most accurate forecasts. Knowing who within your organization or community to reach out to for insight, being able to ask them what they believe and why, can be just as valuable going forward as the forecasts. You can find who your best forecasters are by visiting the Leaderboard section of the application from the top menu.
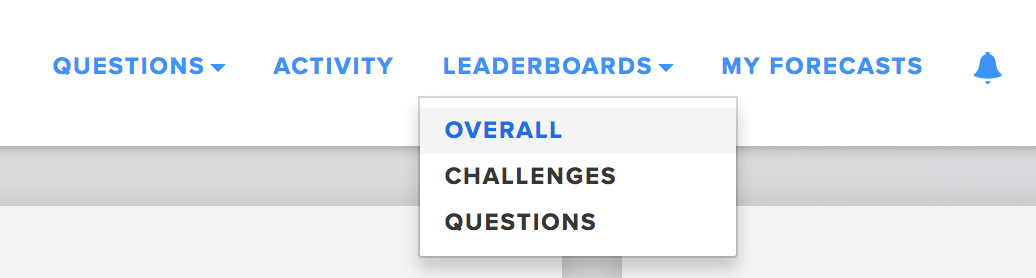
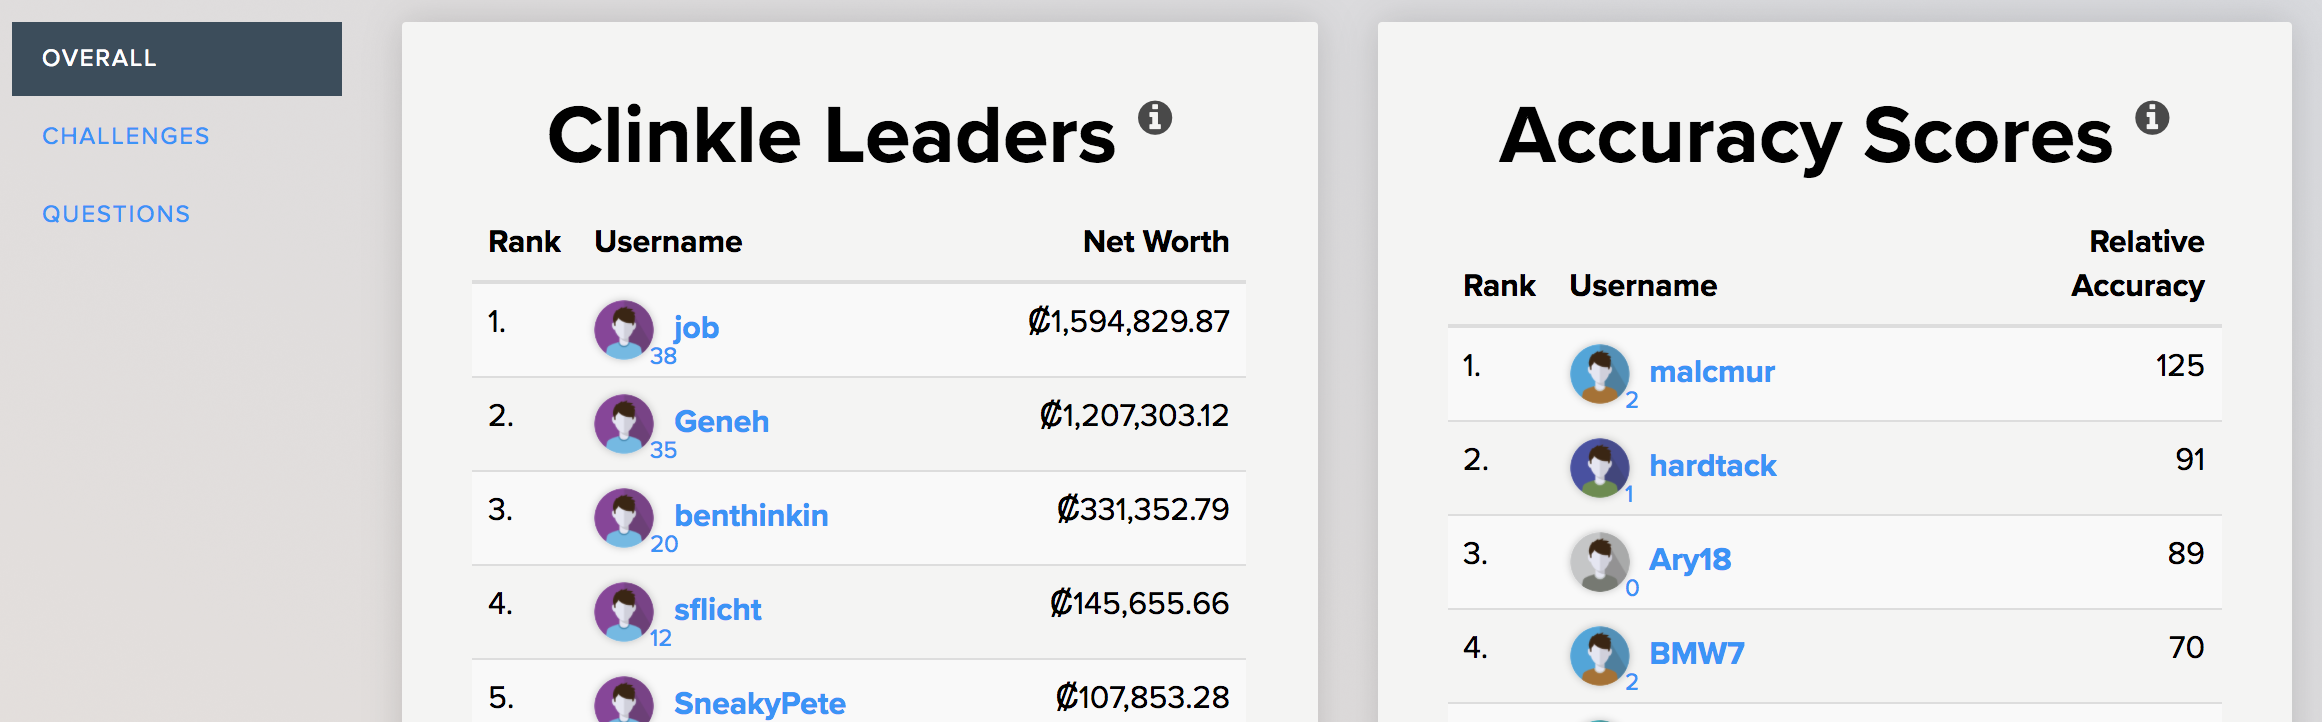
The Overall Leaderboard provides two lists, each containing all users on your site. The first list, Clinkle Leaders, shows the users on your site who have accumulated the most clinkles (the name we have given to the virtual currency that powers the prediction market). The second list, Accuracy Scores, shows the users on your site who have made the most accurate forecasts. Read more about how we calculate accuracy here.

The Questions Leaderboard allows you to choose an individual question that has been resolved and view who the best forecasters were for it.

Additionally, when an individual question has been resolved, a subset of the leaderboard (it is limited to the top 10 forecasters), is displayed on the question page itself. This shows the same information as the Questions Leaderboard, but with the additional context provided by the question page itself, such as a probability history chart and list of forecasts and comments.

Still have questions?
| More support articles | |
| support@cultivatelabs.com |