Cultivate Labs Support Articles
Assessing the accuracy of crowd forecasts
We are often asked about the accuracy of our platforms: how reliable are the forecasts that we generate? Though we prefer to focus on the process of crowd forecasting, rather than accuracy (it’s about the journey, not the destination!), we do appreciate that accuracy is a critical piece of the puzzle that many stakeholders want to know about.
It can be tricky to compare the accuracy of crowd forecasting methods to other traditional forecasting methods because:
- The questions asked are usually not identical;
- Crowd forecasting elicits multiple forecasts over a period of time and encourages forecast updates, while traditional methods often ask about a single point in time; and
- The difficulty of forecasting problems is often mixed, where some are easier and others more challenging.
This post discusses how we measure accuracy on our platforms, with examples from an active crowd forecasting platform, the RAND Forecasting Initiative (RFI). We will also showcase a handful of resources on the benefits of crowd forecasting from an accuracy perspective.
Assessing Accuracy on Cultivate Labs Platforms
To measure accuracy on Cultivate platforms, we use a scoring rule called the relative Brier score, and a measurement called forecast calibration.
Assessing Accuracy Using a Scoring Rule
Each forecaster has a dashboard showing their personal accuracy, which we measure using the relative Brier score, as shown below. Since a Brier score is a measure of forecasting error, lower Brier scores are better. Each time a question resolves which a user has forecasted on, their personal relative Brier score will change. To compute the updated score, we compare the forecaster against the median forecaster. If the user’s forecast was better than the median forecaster, their overall score will improve.
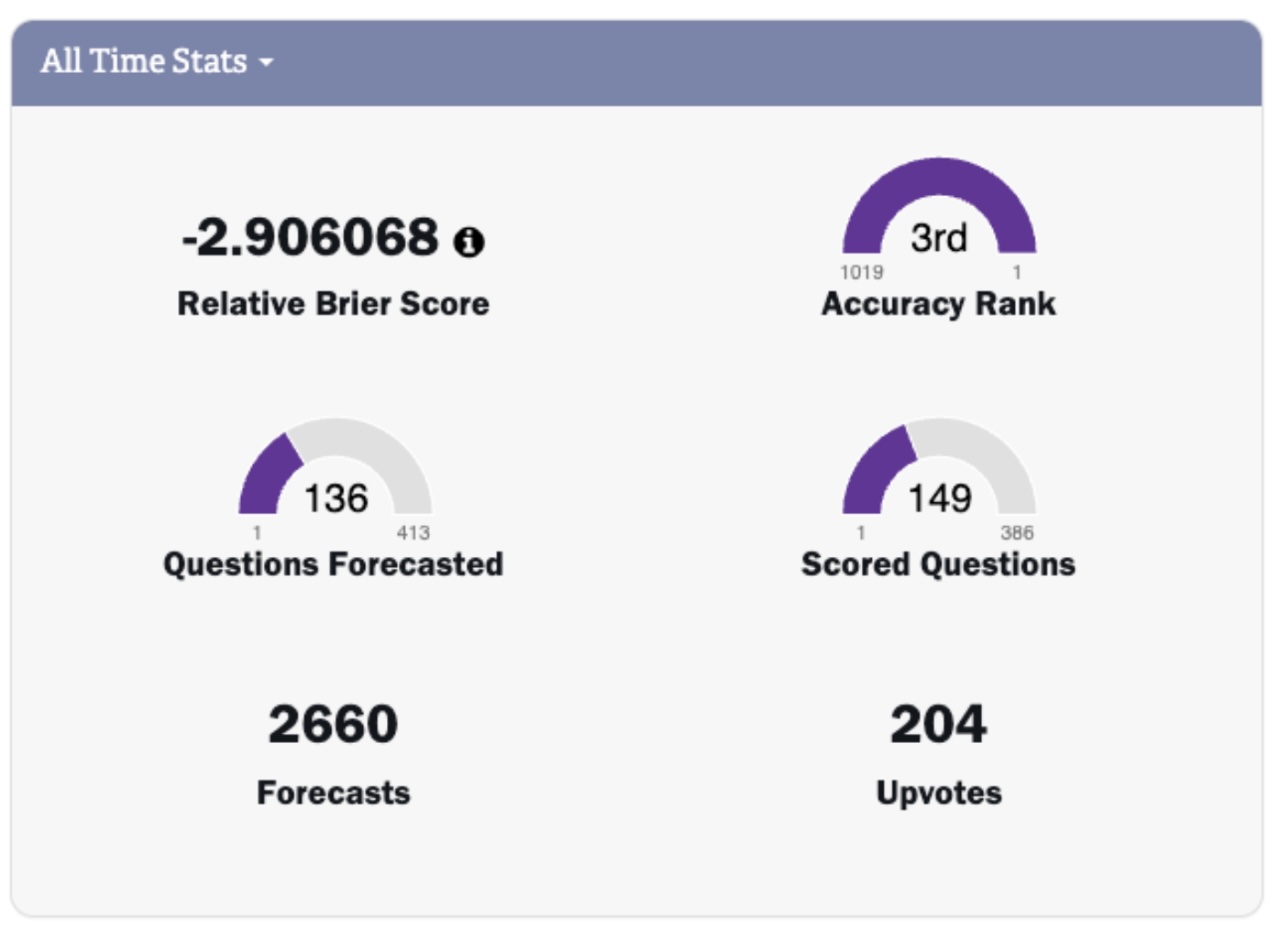
Figure 1. Sample user dashboard showing all time statistics, including relative Brier score
Forecast Calibration
Forecast calibration measures the accuracy of probability assignments by comparing predicted likelihoods to observed outcome frequencies. For example, if we have a platform with 1000 forecast questions, and on 100 of those questions the crowd forecast at a point in time was 10% – when all of these 100 questions resolve, do they resolve “Yes” 10% of the time, and “No” 90% of the time? That would be perfect calibration. It is important to note that just because a forecast is 10%, that does not mean that the crowd is saying that “the event will not happen” – instead, the forecast indicates that it would happen 10% of the time, and that it would not happen 90% of the time. Being “well calibrated” means that you can typically trust the probabilistic judgment – if the crowd forecast is 10%, it actually happens 10% of the time.
We present calibration as a chart representing how well forecasted values on resolved questions align to perfect calibration for each probability range. Below are sample calibration curves from all resolved questions on RFI (as of this writing), showing values from right before question resolution, and 60, 90, and 120 days prior to resolution. The further out we are from resolution, the worse we would expect calibration to be because forecasting is inherently more difficult with less available information. In general, forecasts on RFI are well calibrated, even as we veer further away from the resolution date.
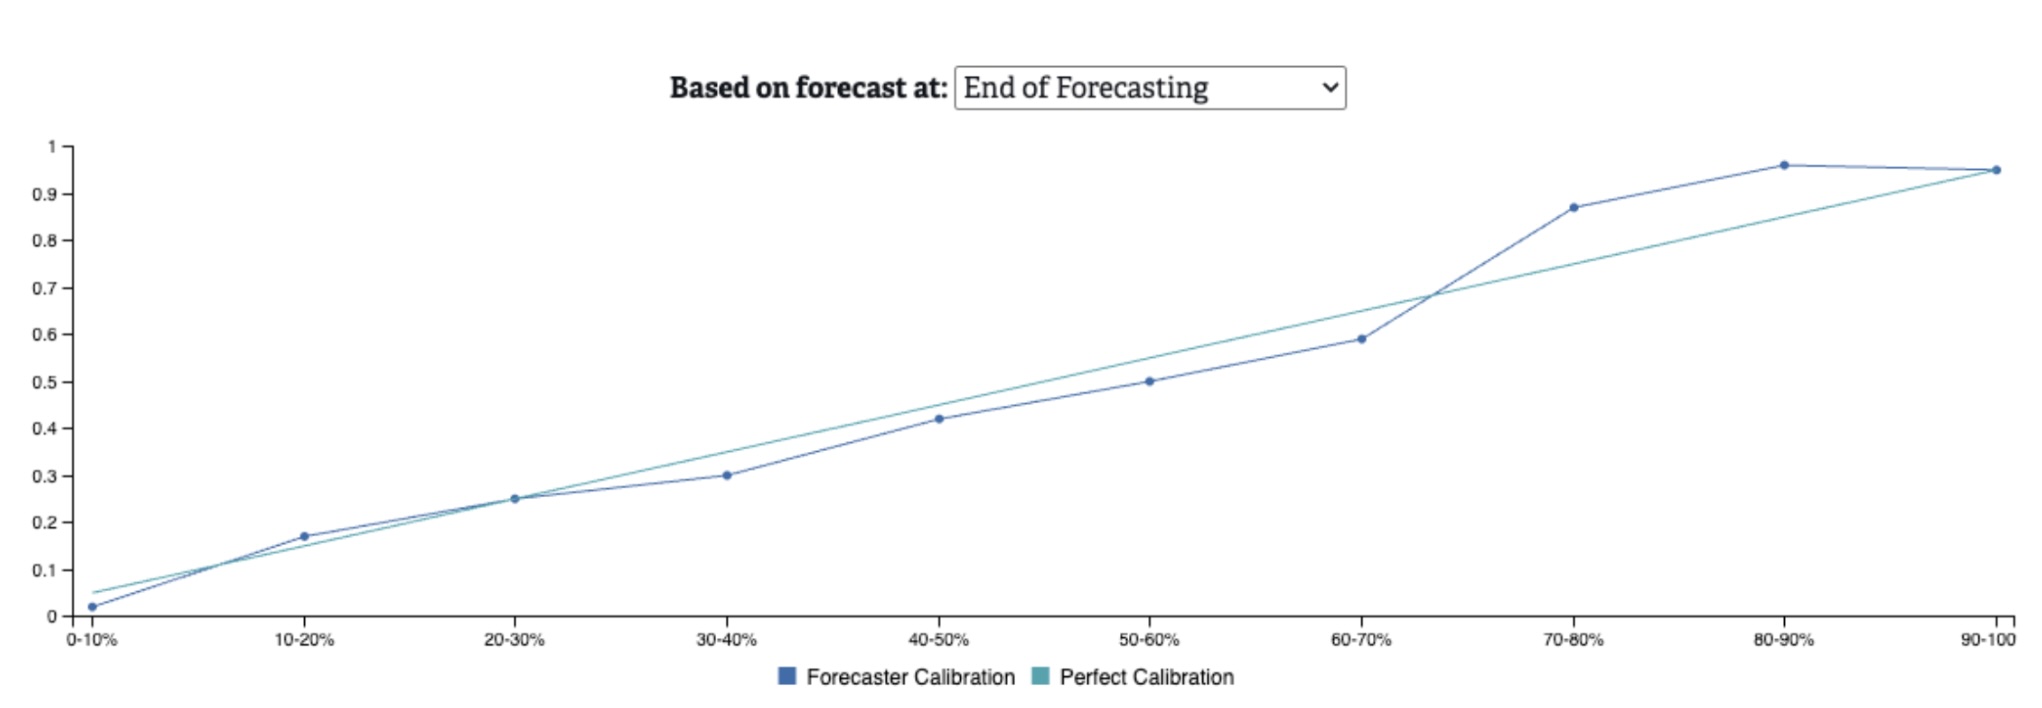
Figure 2. Calibration on all resolved questions at end of forecasting
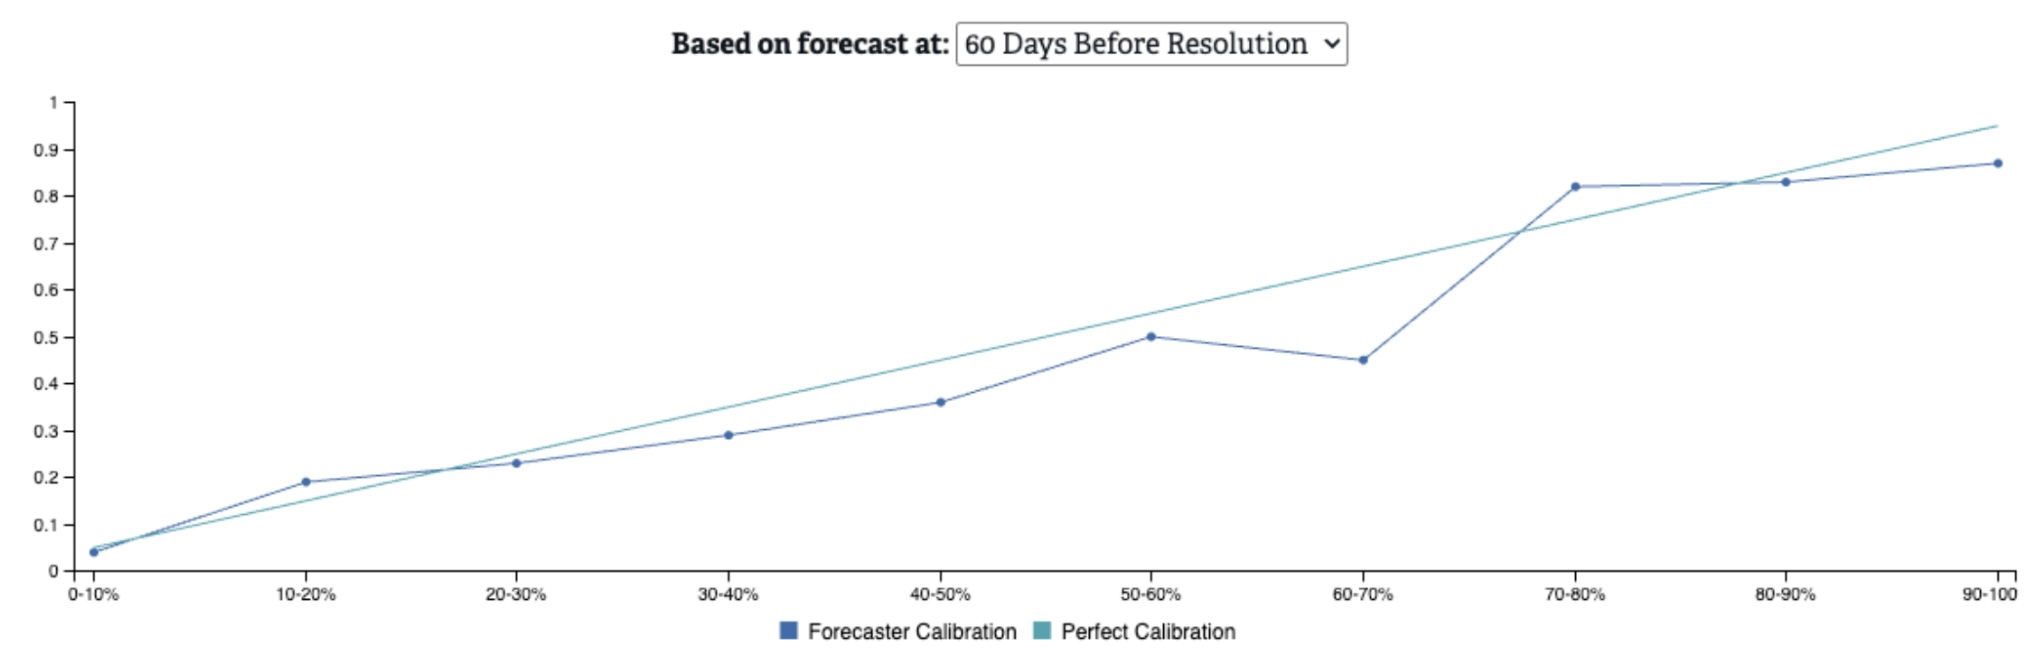
Figure 3. Calibration on all resolved questions at 60 days before resolution
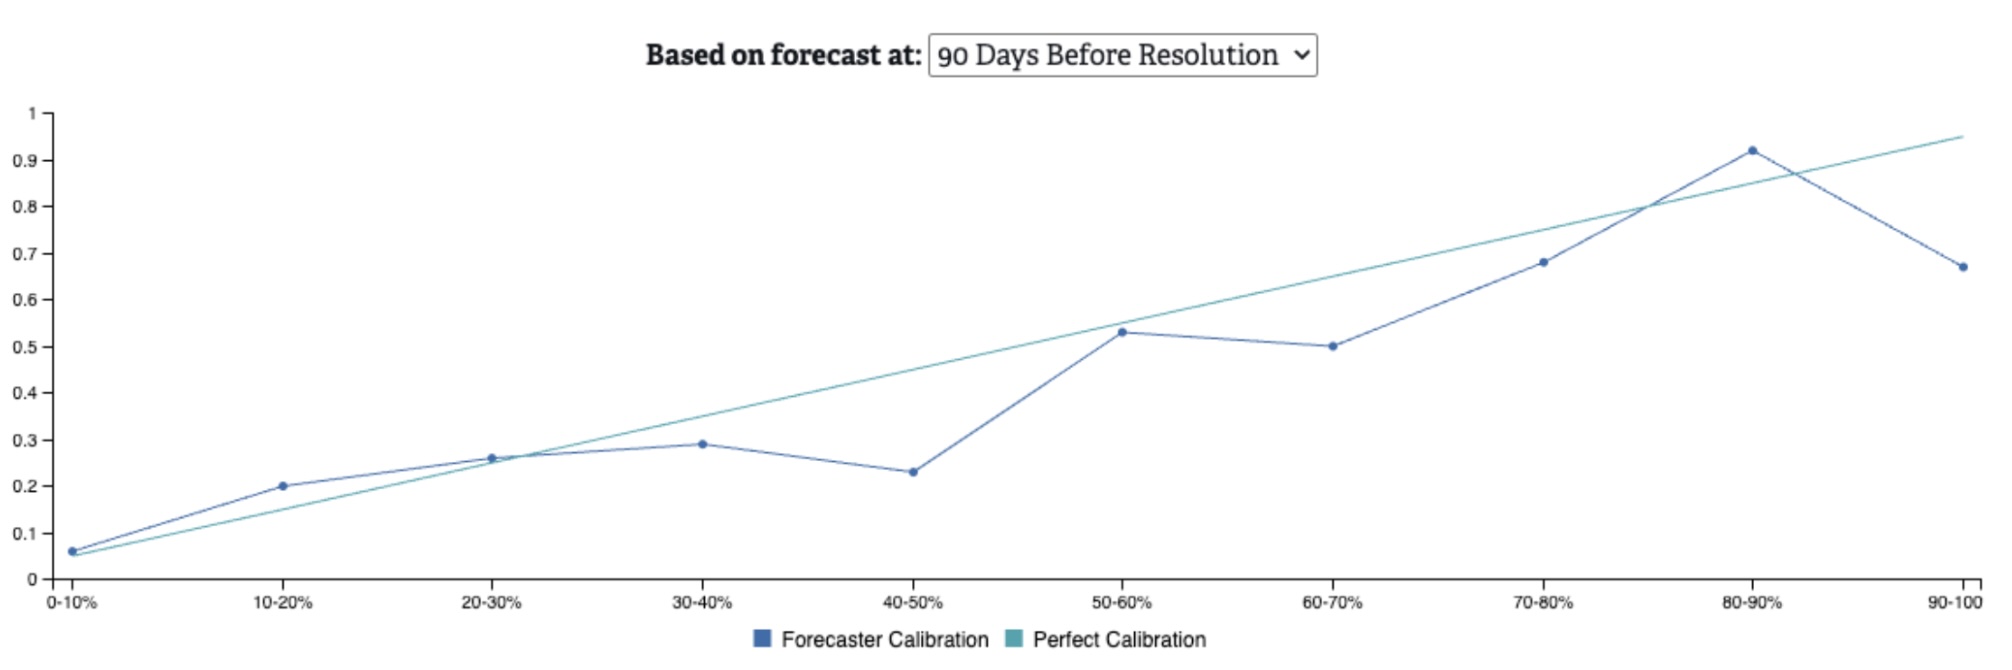
Figure 4. Calibration on all resolved questions at 90 days before resolution
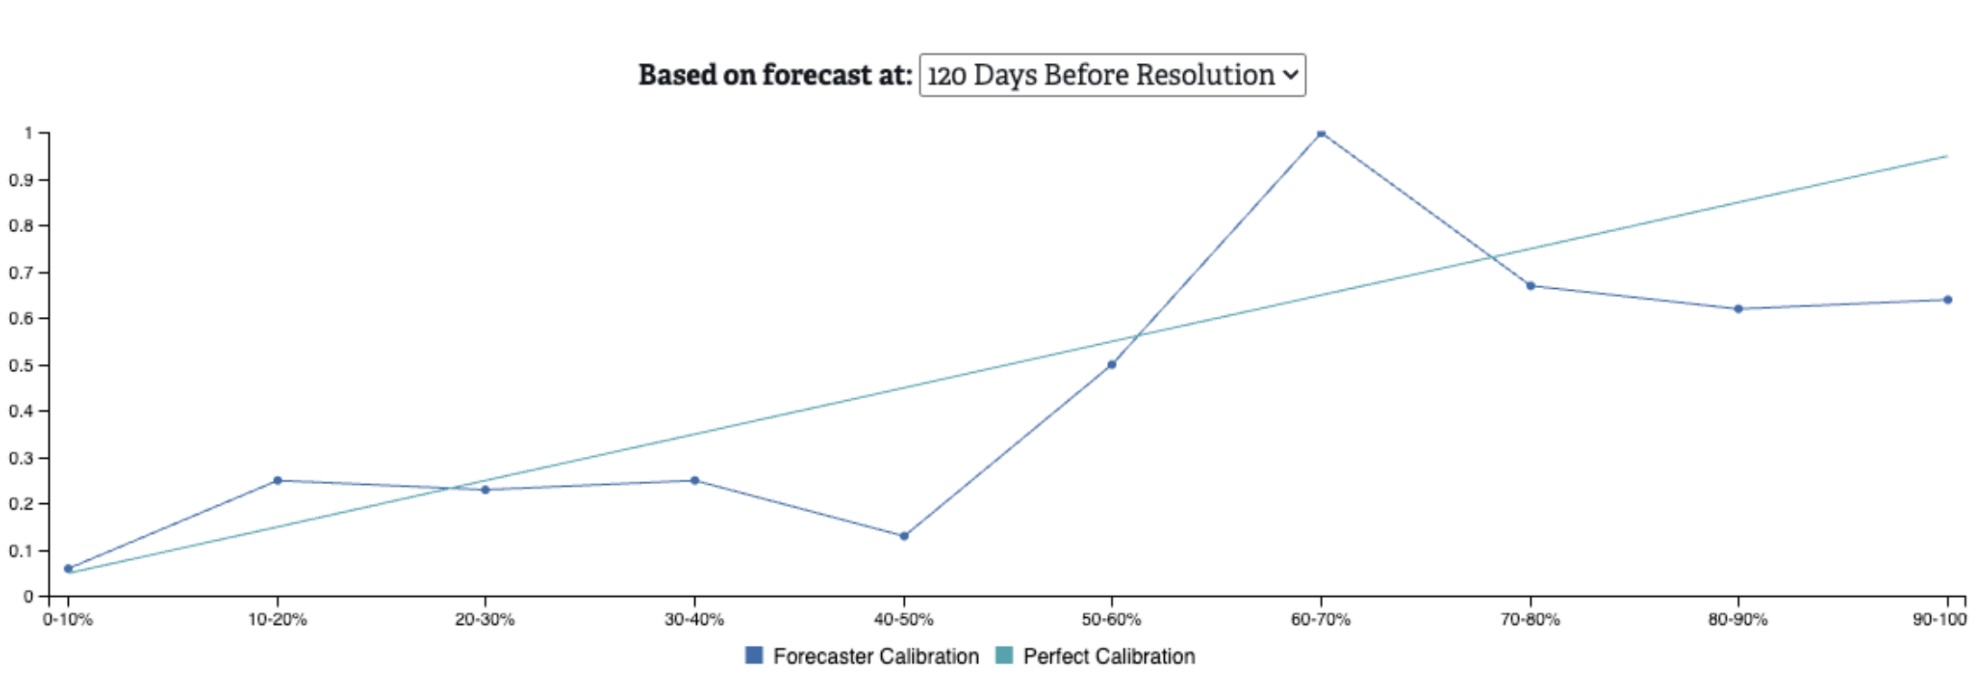
Figure 5. Calibration on all resolved questions at 120 days before resolution
A calibration chart can help to understand the relative under- or over- estimation of the crowd’s forecasts on different types of questions. For example, on the “120 Days Before Resolution” chart, we can see that when the crowd forecasts in the 90-100% probability range, events are only occurring ~64% of the time. This suggests that when we’re ~4 months out from the question’s end, the crowd is over-estimating the likelihood of these events.
When examining calibration charts, it’s also important to be cognizant of how many questions have been resolved in each probability range. If there are very few resolved questions for a given range, then there is likely not enough data to make a meaningful calibration assessment.
Cultivate Labs Posts on Measuring Accuracy
- Assessing the credibility of a crowd forecast
- Determining the Accuracy of Prediction Markets
- Measuring Accuracy in Prediction Markets and Opinion (Probability) Poll/Pools
- Crowdsourced Forecasting & Why it's the Best Forecasting Tool Around
- What is forecast calibration?
Additional Research and Resources
There have been a number of research studies centered around how crowd forecasting benefits decision making for its superior accuracy over traditional decision making methods:
- The Wisdom of Crowds in Operations: Forecasting Using Prediction Markets (link to paper): On the benefits of crowd forecasting in operations management.
- How crowdsourcing improves prediction of market-oriented outcomes: How crowd forecasting outperforms traditional forecasting methods in business decisions.
- The Value of Precision in Probability Assessment: Evidence from a Large-Scale Geopolitical Forecasting Tournament: On the benefits of quantitative probabilistic forecasting alongside language-based rationales.
- The Science of Superforecasting: Includes links to many related papers on the science behind crowd forecasting.
- Vox Populi by Francis Galton: Original paper by Galton about the accuracy of crowd judgments on the weight of an ox at an annual exhibition.
- The Wisdom of Crowds by James Surowiecki: Book about the value of crowd judgments as opposed to those of individual experts.
Still have questions?
| More support articles | |
| support@cultivatelabs.com |